

First of all, why do I need to understand and visualize data?
You need to visualize data because how can you measure your marketing objectives and goals without knowing the numbers coming from your digital campaigns? Also, how will you be able to show your information to others and sell the idea that you have an excellent or terrible result and that you need to stop the campaign?
A marketer who cannot identify some data points in a campaign is like a blind person driving a big truck at the I-95 or any other highway, a recipe for disaster.
The four types of data visualization
Data visualization represents information in a picture, chart, diagram, sketch, drawing, doodle, etc. How you present the information will depend on your target audience.
Suppose you are a seventh grader teacher, and the day’s class is to talk about the characteristics and specifications of the Rocket Artemis I. In that case, you probably will use pictures and diagrams of how a rocket functions for a level of 12-13 years old teenager.
But if you are a contractor working on the same project and need to show some detailed information to a NASA team group, your charts and diagrams will be more complex because you will not be talking to teenagers but to people specializing in the field.
Also, following the NASA contractor example, the information you will show will depend on the data you deliver. For Example, if you are an Engineer and describe the functioning of a fuel system, you will use a specific chart or graphic. However, if you also want to show the fuel system’s performance, the forms and graphs will be different too.
Scott Berinato, in his book Good Charts, proposed four types to visualize data: Conceptual-declarative, conceptual-exploratory, data-driven-declarative, and data-driven-exploratory.
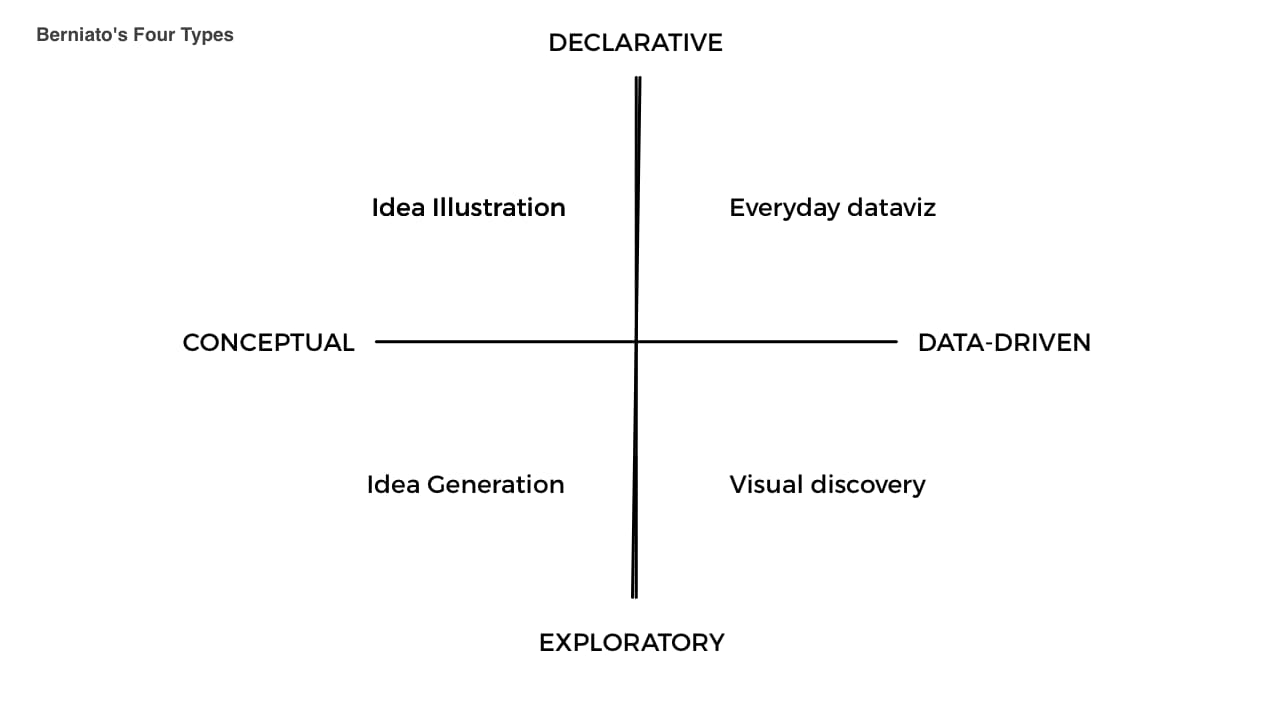
Each quadrant will give you an idea of which form of communication you will use to display your information.
- Conceptual-Declarative (Idea Illustration). In this quadrant, you will use a diagram to describe complex ideas. This diagram will be a simple, straightforward, clean design—examples are organizational charts or cycle diagrams.
- Conceptual-Exploratory (Idea Generation). Like the idea illustration, this quadrant relies on conceptual metaphors to describe an idea in a more informal way—for Example, a logo drawing, some scribbles to identify a process or a slogan.
- Data-Driven-Declarative (Everyday dataviz). In this quadrant, the data visualization is dedicated to basic charts and graphs. The data set tends to be minor. You must be clear and consistent to present the data effectively—examples: linear charts, bar charts, and pies.
- Data-Driven-Exploratory (Visual Discovery). This quadrant is the most complex. Data visualization is focused on functions, not form, asking questions. The information is used to confirm hypotheses, find trends, and explore business intelligence analysis. This quadrant can produce insights and research with multiple variables. Even though you will use well-known graphics like linear, bars, pies, etc., you will be pulling the data from visualization and stats software. Example: Power BI, Tableau, etc.
So the idea of this data visualization model designed by Berniato is to explain in an effortless way how you should present your data.
Is the information you are presenting conceptual or data-driven?
Suppose you are presenting a project for a new website UX interface. In that case, the information is qualitative because you will be presenting a graphic mockup. Still, if you are showing the results of a campaign, you will give data-driven or quantitative information like click-through rates, website sessions, cost per lead, etc.
Is the information to be declarative or exploratory?
If you are presenting financial statements, results of a fiscal year, a business plan or a lead generation campaign to an audience, you are informing, so the visualization type should be declarative. But if you run an AB testing campaign, you explore options to implement and discard procedures or campaigns.
Understanding data is key to success, but how you present can clarify or explain a situation or create tremendous confusion with your target audience if you don’t define first what type the data you are working on.
Again, when you want to present some information, think first about your purpose and audience, then use the proper ways and tools to communicate and visualize your data. In this way, your target audience will be able to understand better what you are trying to do.