

An infographic is a simple way to tell a story and catch the attention of viewers.
An infographic is a collection of text copy, images and sometimes videos to visualize or represent data. The whole point is to use infographics to offer an easy way to understand complex data.
The first step to create an infographic is define your goals, what do you want to accomplish?, then define your audience, who is going to view your infographic, internal corporate communications, people outside of the organization or general public, if general public, who are they?. Then order your data in a logical hierarchy and then choose the type of infographic you will be using for data visualization and finally, pick and customize your template. I recommend canva.com easy to use tool to create not only infographics, but also flyers, social media posts and videos, invitations, business cards, etc.
Types of infographics
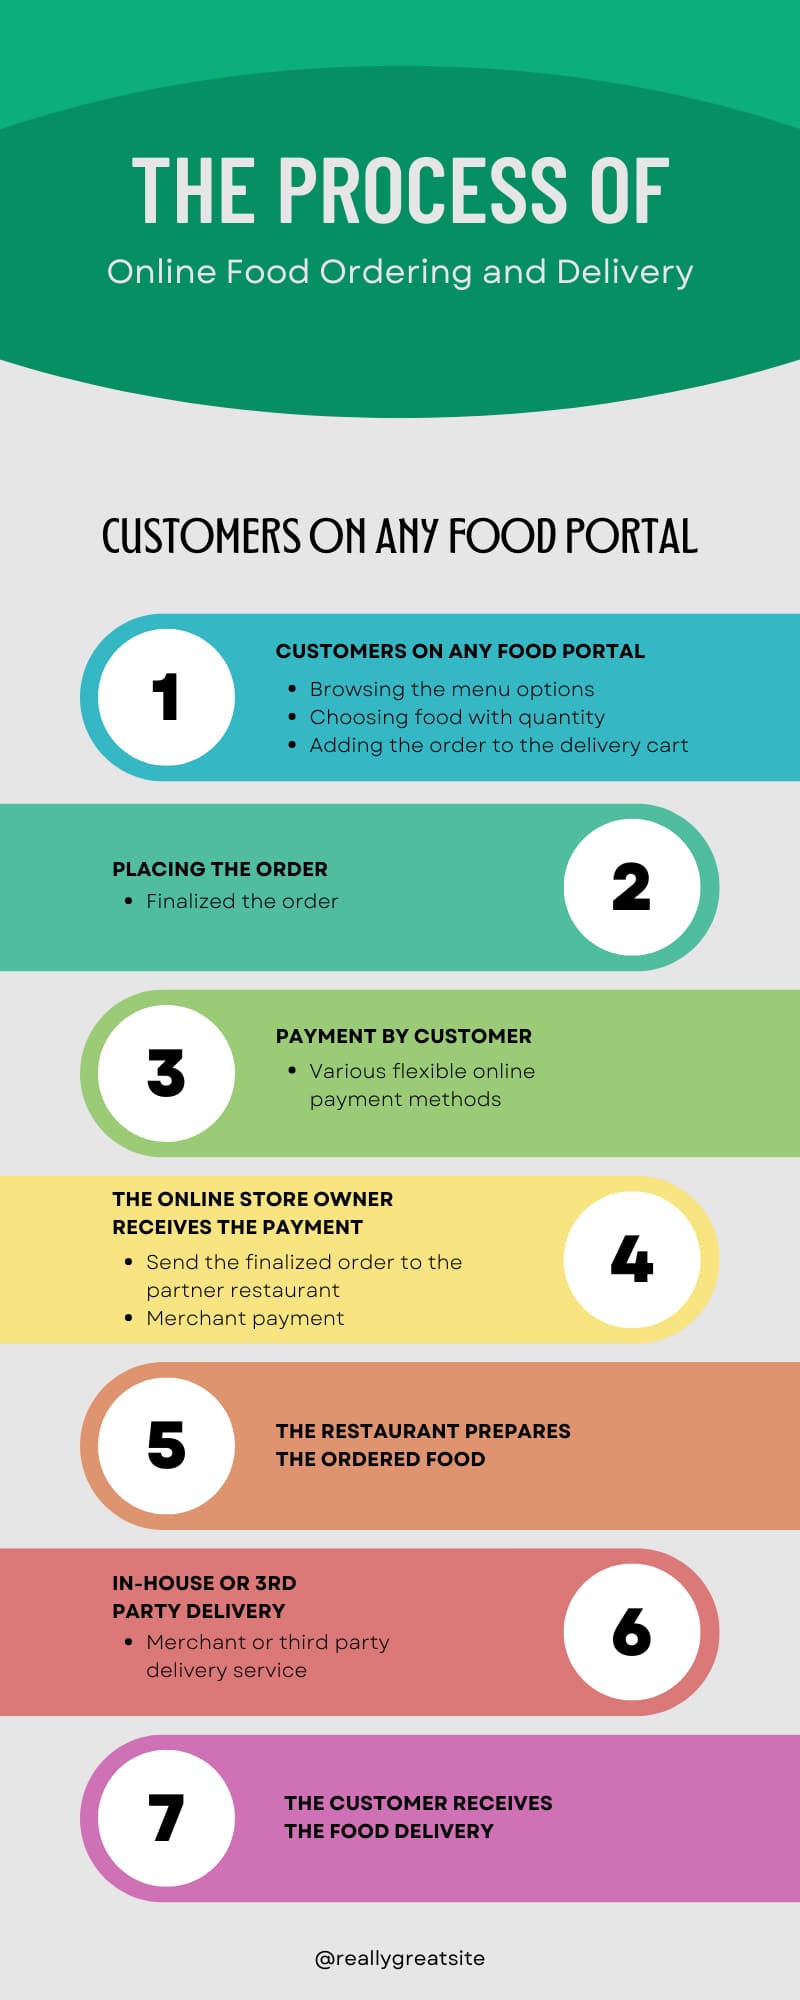
List. These infographics present the information in a list-based format, it allows readers to read the contents in order. You can use this type of infographic when you want to highlights in order certain contents. Like a list of tasks to do to accomplish a business goal.
Comparison. These infographics compares two or more information, so readers can compare the pros and cons or the differences between some topics. Like financial results from 2022 and 2021.

Flowchart. These infographics shows procedures, steps to accomplish a task or a project, organizational structures, etc. using shapes, dots, arrows, etc.

Visual Article. These infographics help writers to use visual elements to explain the contents of an article. It helps readers understand and go through the contents very quick.

Map. These type of infographics helps to show demographic and geographic data through the use of maps. Like location based statistics, geographical data, demographical data, etc.

Timeline. These type of infographics are good when you want to show the history of a process, product, service, etc. It helps to show the chronological events of something.

Data Visualization. These type of infographics use charts or graphs to represent complex data in a simple way. Like financial trend, the cost of production certain product, etc.

As you can see infographics are an easy way to show and tell complex stories in an easy way. You don’t need to be a Graphic Designer professional to prepare an infographic, just the right tools, know how to use it and of course understand the basics, so you can display the right data to your right target audience.